10.5 Transforming Variables with dplyr
In dplyr you transform variables with the function mutate(). Here is an example:
survey %>%
  mutate(dareDevil = fastest > 125) %>%
  select(sex, fastest, dareDevil)
## # A tibble: 71 x 3
## sex fastest dareDevil
## <fct> <int> <lgl>
## 1 male 119 FALSE
## 2 male 110 FALSE
## 3 female 85 FALSE
## 4 female 100 FALSE
## 5 male 95 FALSE
## 6 male 100 FALSE
## 7 male 85 FALSE
## 8 male 160 TRUE
## 9 female 90 FALSE
## 10 female 90 FALSE
## # … with 61 more rowsIn mutate() there is always a variable-name on the left-hand side of the = sign. It could be the same as an existing variable in the table if you are content to overwrite that variable. On the right side of the = is a function that can depend on variables in the data table.
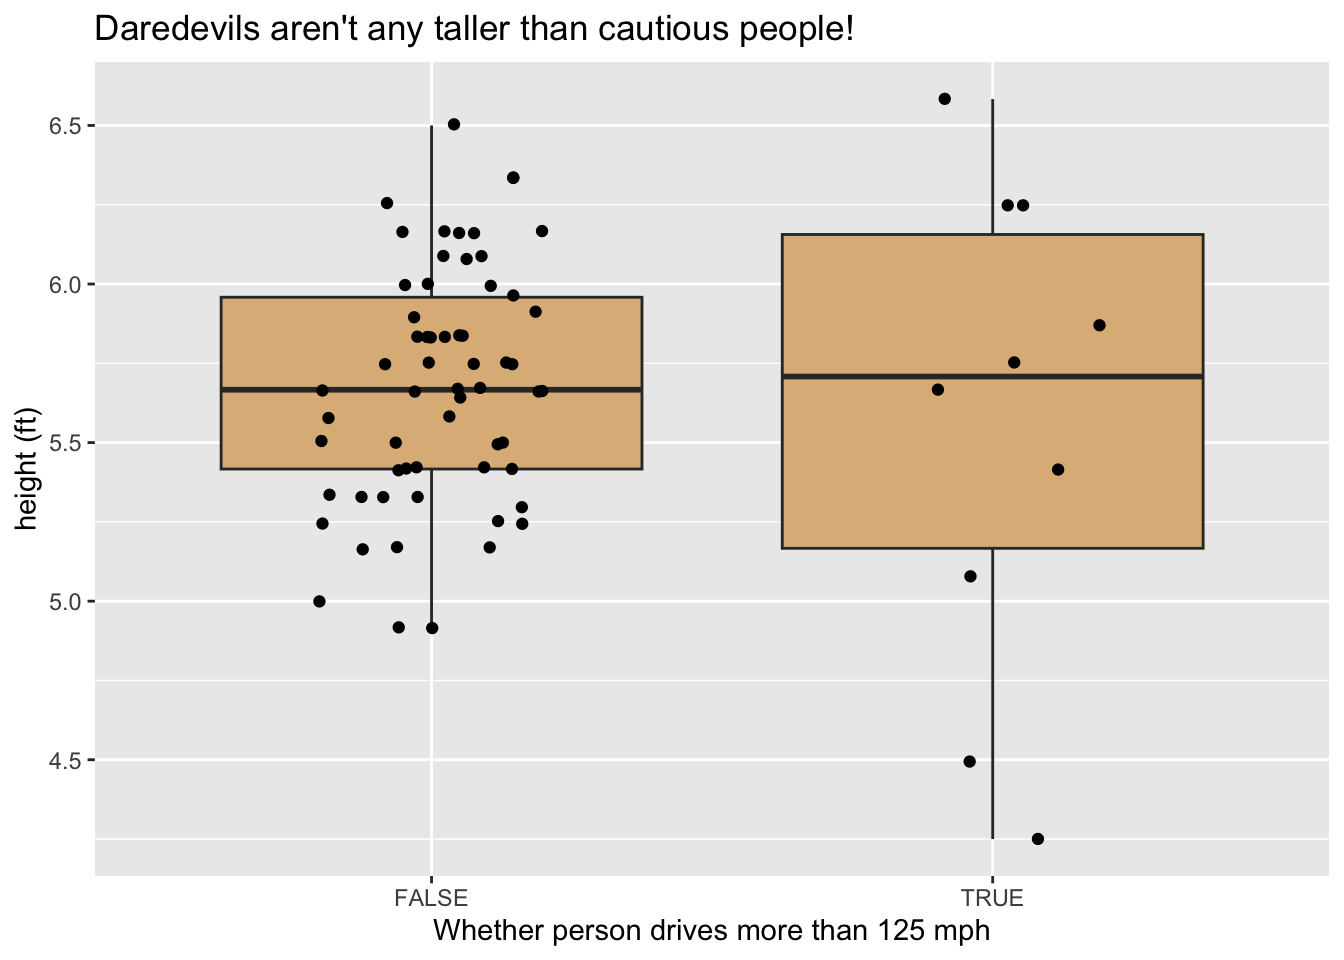
You can transform more than one variable in a single call to mutate(), as in the code below. The output is shown in 10.2.
survey %>%
  mutate(dareDevil = fastest > 125,
         speedKmHr = fastest * 1.60934) %>%
  ggplot(aes(x = dareDevil, y = GPA)) +
    geom_boxplot(fill = "burlywood", outlier.alpha = 0) +
    geom_jitter(width = 0.2)
Figure 10.2: Graph produced after mutation.
10.5.1 Practice Exercises
- In
mosaicData::CPS85transform thewagevariable to units of dollars per day. (Assume an 8-hour working day.)
10.5.2 Solutions to Practice Exercises
Try this:
CPS85 %>%
  as_tibble() %>%                   # for display in Console
  mutate(dailyWage = wage * 8) %>%
  select(sex, sector, dailyWage)    # for display in Console
## # A tibble: 534 x 3 ## sex sector dailyWage ## <fct> <fct> <dbl> ## 1 M const 72 ## 2 M sales 44 ## 3 F sales 30.4 ## 4 F clerical 84 ## 5 M const 120 ## 6 F clerical 72 ## 7 F service 76.6 ## 8 M sales 120 ## 9 M manuf 88 ## 10 F sales 40 ## # … with 524 more rows