5.1 Basic Movements
First, we begin by loading the package:
library(TurtleGraphics)In order to create a Turtle Graphics scenario, call the function turtle_init(). You get the plot shown in Figure 5.2.
turtle_init()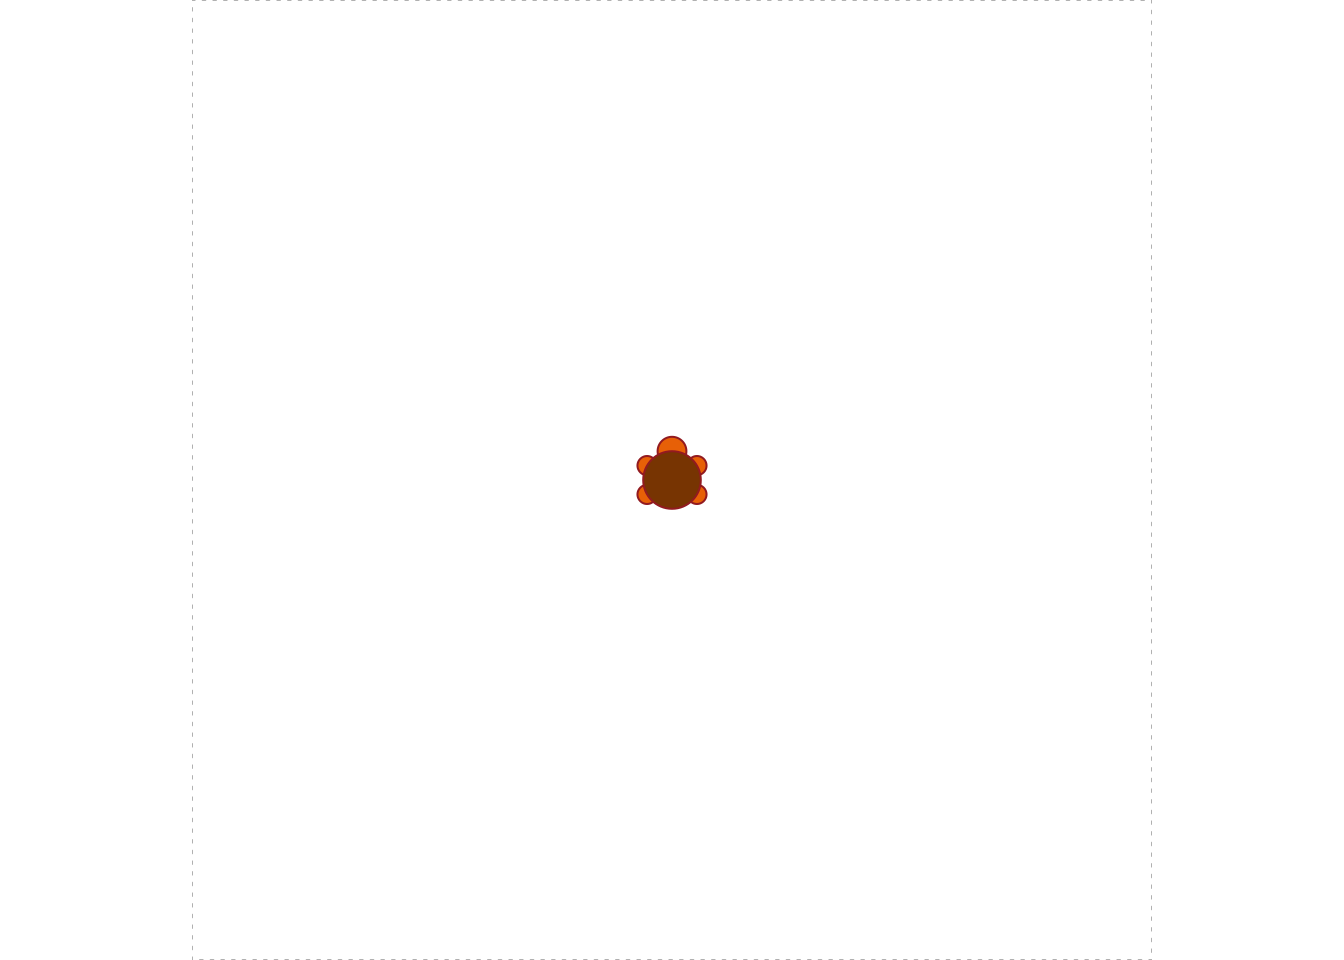
Figure 5.2: Initialized Turtle
By default the turtle is positioned in the middle of a square of dimensions 100 units by 100 units. (These dimensions can be changed, as we will see later on.)
You can get the turtle’s position at any time:
turtle_getpos()## x y
## 50 50 The turtle also begins facing North. This is considered to be angle 0, as you can tell by asking for the current angle of the turtle:
turtle_getangle()## angle
## 0 Now let’s make the turtle move. If you are following along on your own computer, it’s best to run the lines of code one at a time, so you can see the effect of each command. (If you run multiples lines, you’ll only see the graph produced by the final line.)
turtle_forward(dist = 30)
turtle_backward(dist = 10)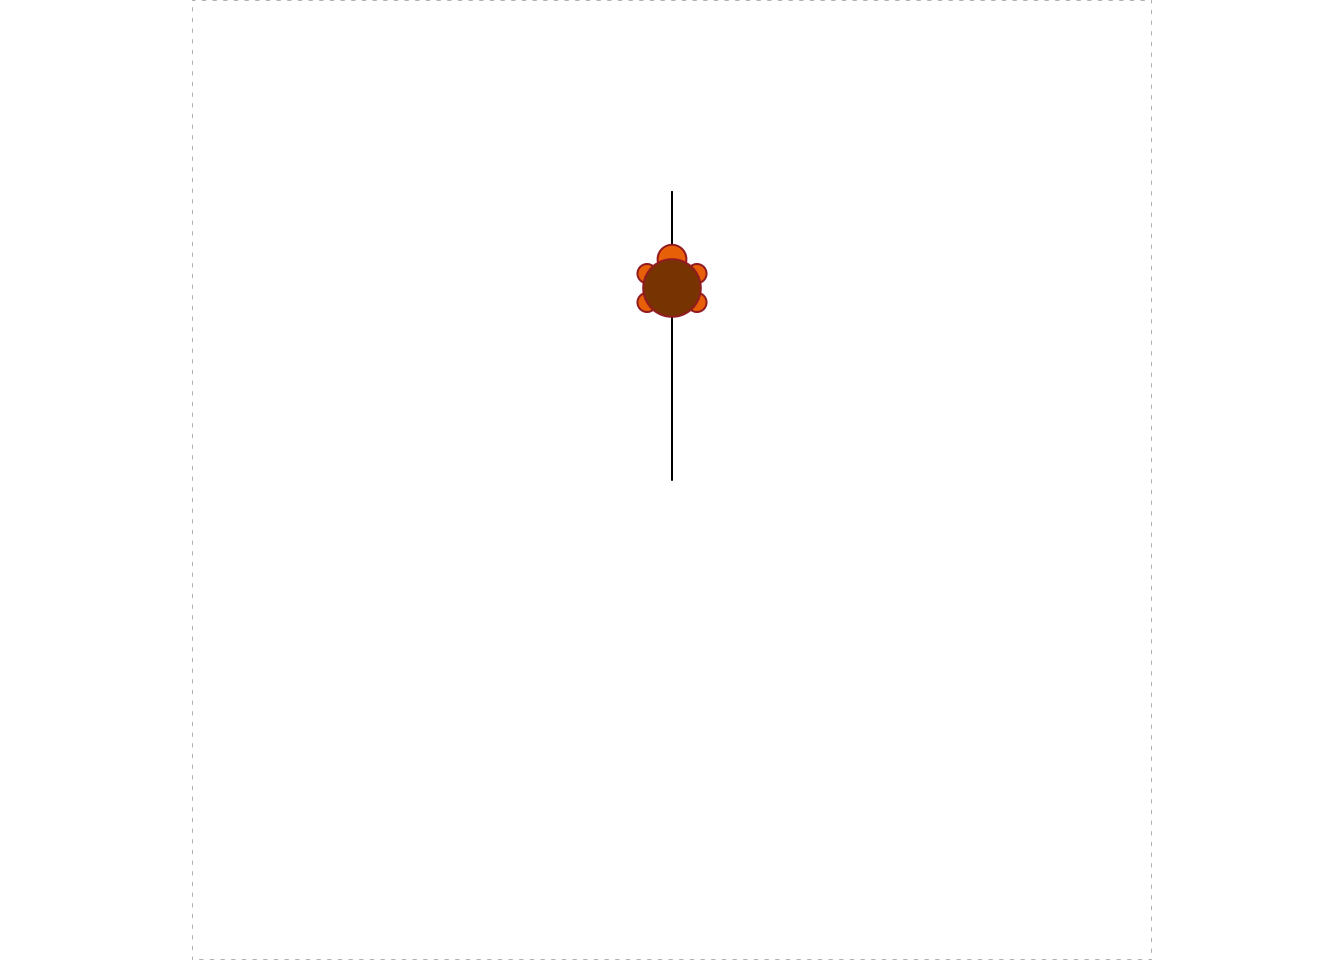
Figure 5.3: First Movements
The result appears in Figure 5.3. Next we’ll add a little triangle:
turtle_right(90)
turtle_forward(10)
turtle_left(angle = 135)
turtle_forward(14.14)
turtle_left(angle = 90)
turtle_forward(14.14)
turtle_left(angle = 135)
turtle_forward(10)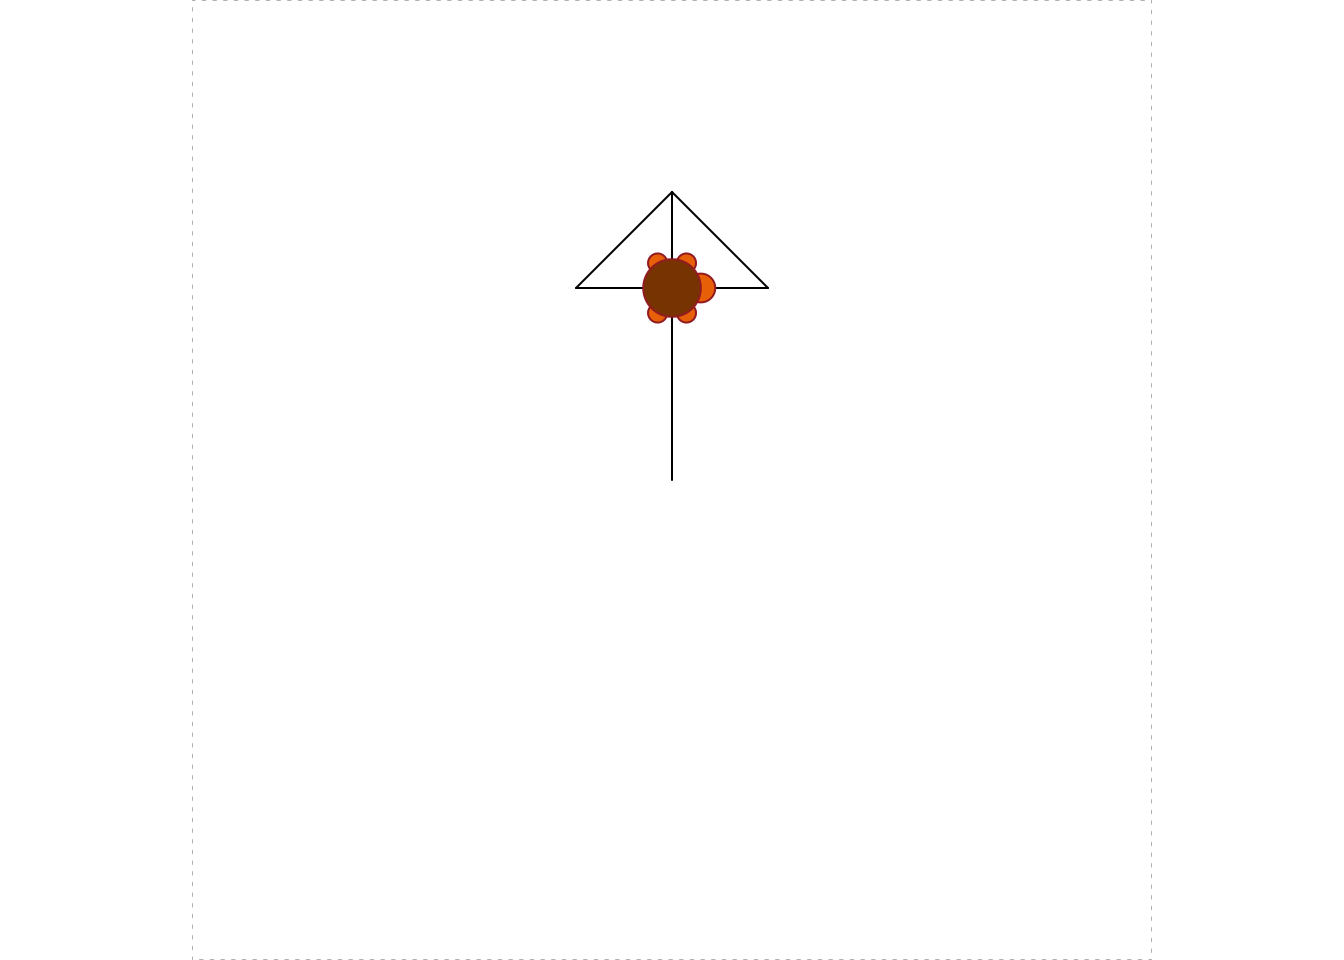
Figure 5.4: Adding a Triangle
You can see the triangle in Figure 5.4.
The turtle is set in the “down” position, so that it leaves a trace out the path that it follows. You can avoid the trace by pulling the turtle “up” with turtle_up(). Whenever you want to restore the tracing, call turtle_down(). See Figure 5.5 for the results of the following code.
turtle_up()  # stop tracing
turtle_right(angle = 90)
turtle_forward(dist = 10)
turtle_right(angle = 90)
turtle_forward(dist = 17)
turtle_down()  # start tracing again
turtle_left(angle = 180)
turtle_forward(dist = 34)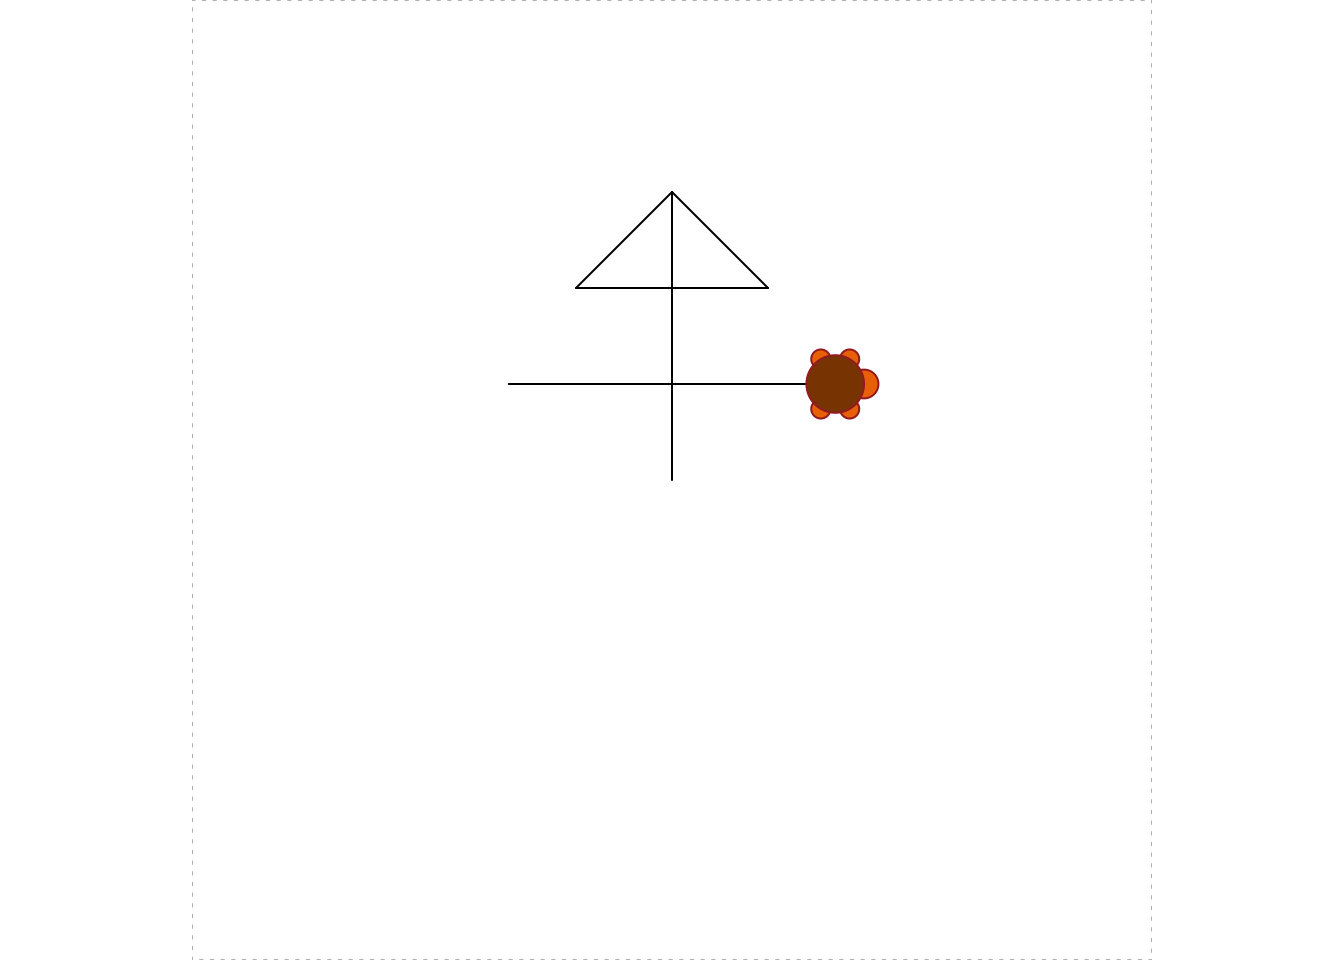
Figure 5.5: We moved the turtle around in the up position, then put the turtle down and traced out a line segment.
You can change the color of the lines your turtle draws:
turtle_col(col = "green")In R here are many, many colors to choose from, and 657 of them even have names. To view them, use:= the colors() function:
colors()You can also hide your turtle, and show it again any time you like. See Figure 5.6 for the results of the following code.
turtle_hide()
turtle_left(angle = 150)
turtle_forward(dist = 20)
turtle_left(angle = 60)
turtle_forward(dist = 20)
turtle_show()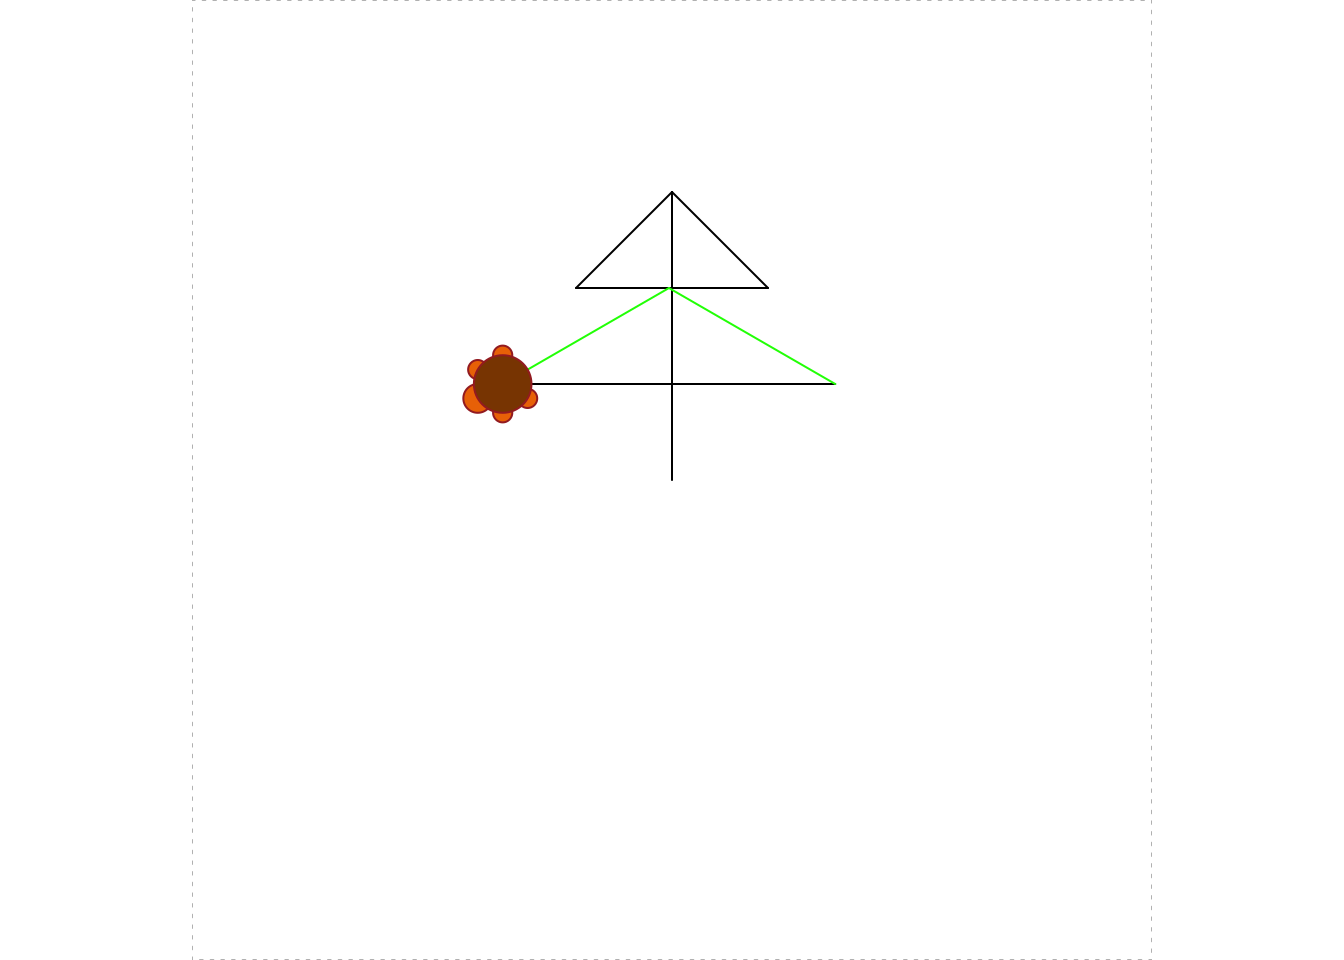
Figure 5.6: The graph after hiding, moving and showing.
Finally, you can choose the type of line your turtle draws, and the width of the line. See Figure 5.7 for the results of the following code.
turtle_left(angle = 150)
turtle_lty(lty = 4)
turtle_forward(dist = 17)
turtle_lwd(lwd = 3)
turtle_forward(dist = 15)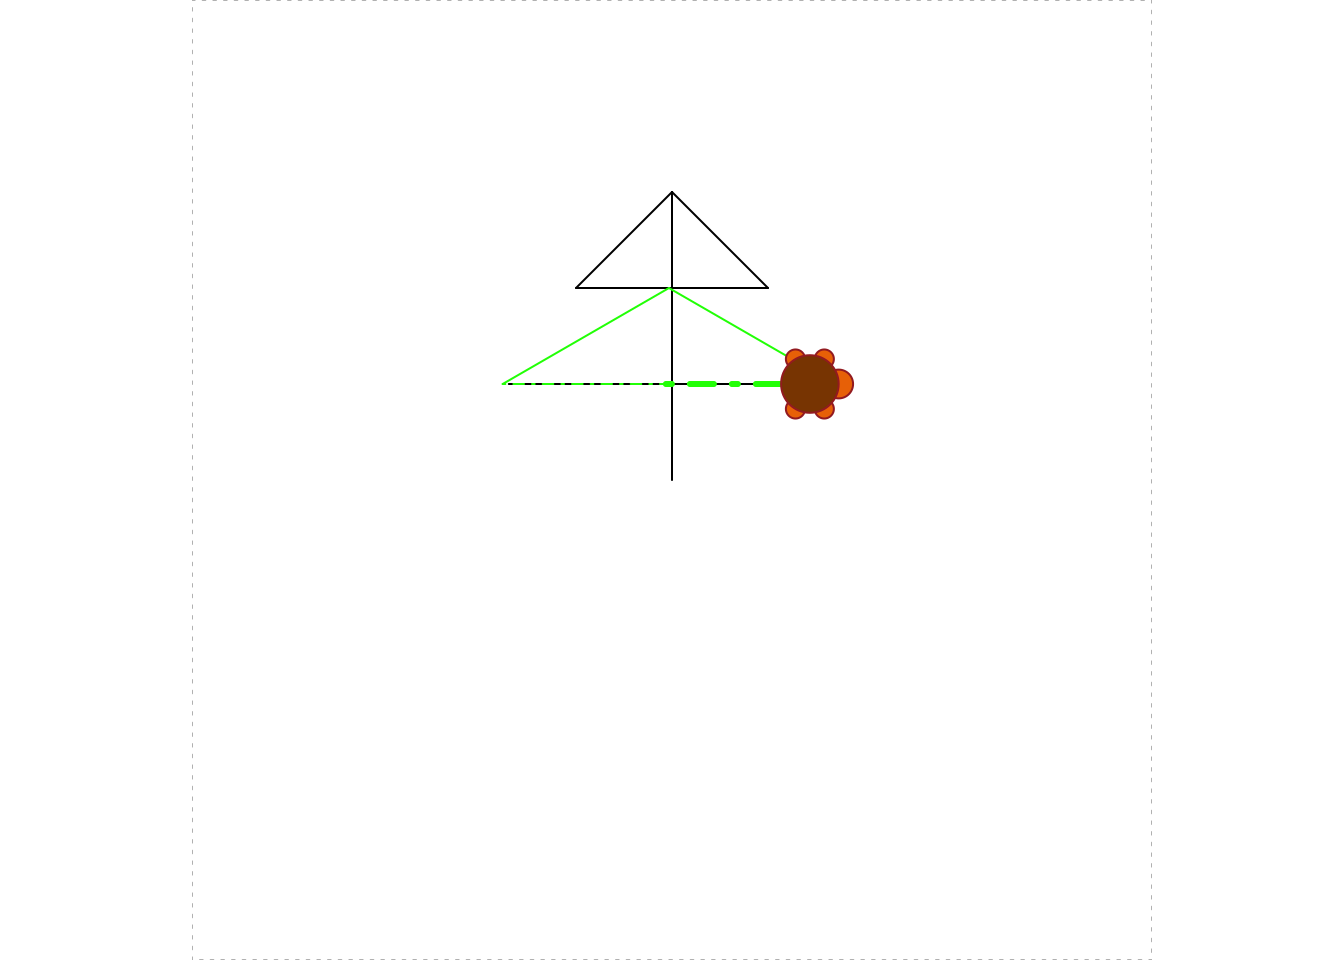
Figure 5.7: Choosing line-type and line-width.
Note: you can learn more about lty and lwd with help(par).