Exercises

Write a new class called Witch that inherits from class Person. It should have two additional properties:
slippers: Color of slippers worn by an individual witch. The initial value should be NULL.region: the part of Oz over which an individual witch reigns (e.g., “North,” “South,” etc.). The initial value should be NULL.
The class should include set-methods for both
slippersandregion. In addition there should be aninitialize()method that overrides the method already provided with class Person. This new method should permit the user to set the value ofslippersandregion.Create two new witches:
- The Wicked Witch of the East. Her name and desire are up to you, but her slippers should be silver, and of course she should reign over the East.
- Glinda, the Good Witch of the North. Her desire and color of slippers are up to you.
Install the package bcscr, if you have not done so already:
devtools::install.packages("homerhanumat/bcscr")Study the documentation for the classes
Ocean,FemaleandMale, and then write your own ocean simulation in which the initial whales have properties that you select.Run the simulation, initializing the ocean with ten whales of each sex and report on the results in an R Markdown document. (Note: Don’t run animations in an R Markdown document.)
Recall the function
meetupSim()from Section 6.4, with which we investigated the probability that Anna and Raj would meet at the Coffee Shop. Suppose that we are interested not only in the probability that they meet, but also in the distribution of the number of minutes by which the latecomer misses the one who came early on the occasions when they do not manage to connect. RevisemeetupSim()so that it does not print any results to the console, but instead returns a list. The list should have two elements:- a logical vector indicating, for each repetition of the simulation, whether or not Anna and Raj met;
- a numerical vector indicating, for each repetition in which they did not meet, the number of minutes by which the latecomer missed meeting the person who arrived earlier.
Make the list have class “meetupSims.” A typical example of use should look like this:
results <- meetupSim(reps = 10000, seed = 3535)
str(results)
## List of 2 ## $ connect: logi [1:10000] FALSE FALSE TRUE FALSE TRUE FALSE ... ## $ noMeet : num [1:6934] 30.275 29.959 22.394 0.491 4.898 ... ## - attr(*, "class")= chr "meetupSims"Building on the previous exercise, write a method-function called
print.meetupSims()that prints the results of a meet-up simulation to the console. The function should provide a table that gives the proportion of times that Anna and Raj met, and a numerical summary of the simulation results when they did not meet. (You could use thesummary()function for this.) A typical example of use would look like this:results # has same effect as print(results)## Here is a table of the results, based on 10000 simulations. ## ## Did not connect Connected ## 0.6934 0.3066 ## ## Summary of how many minutes they missed by: ## ## Min. 1st Qu. Median Mean 3rd Qu. Max. ## 0.00131 6.60680 14.55711 16.55834 24.87720 49.30534Continuing in the same vein, write a method-function called
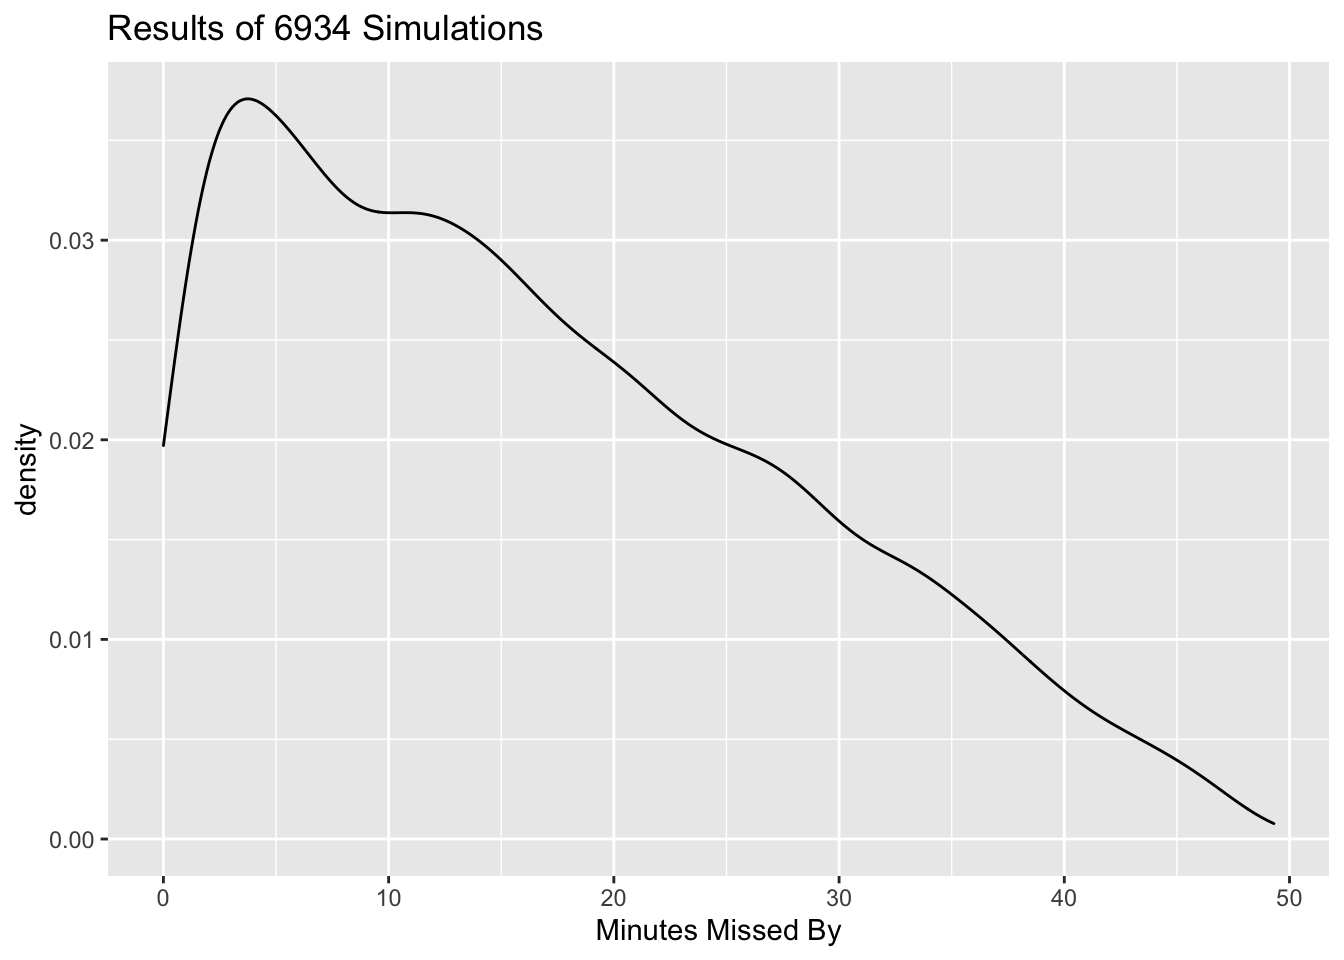
plot.meetupSims()that makes a density plot showing the distribution of the number of minutes by which the latecomer misses the meeting. It should work like this:plot(results)
Write a generic function called
ypos()that will return the \(y\)-coordinate of points of classcartesianPointandpolarPoint. Of course you will need to write the corresponding method functions, as well.Write a generic function called
norm()that will return the distance of a point from the origin. The point could be of classcartesianPointorpolarPoint, so you will need to write the corresponding method functions, as well. (It will be helpful to recall that for a point with Cartesian coordinates \((x,y)\) the distance from the origin is \(\sqrt{x^2 + y^2}\).)